PROJECT
MARCO — Cornare
UX/UI design of homepage, header, footer, educational module, and internal environmental data dashboards for Cornare, developed with Rain Ingeniería.
2023
Year
UI/UX Design & Design System
Category
UI/UX Design for Rain Ingeniería (Homepage, Header, Footer, Educational Module & Internal Dashboards for Cornare)
My Role
Figma, Design Systems, UX Research, Data Visualization, GIS Mapping
Tools
OVERVIEW
An intuitive geospatial design system and platform for watershed monitoring, river levels, and climate alerts.
Context
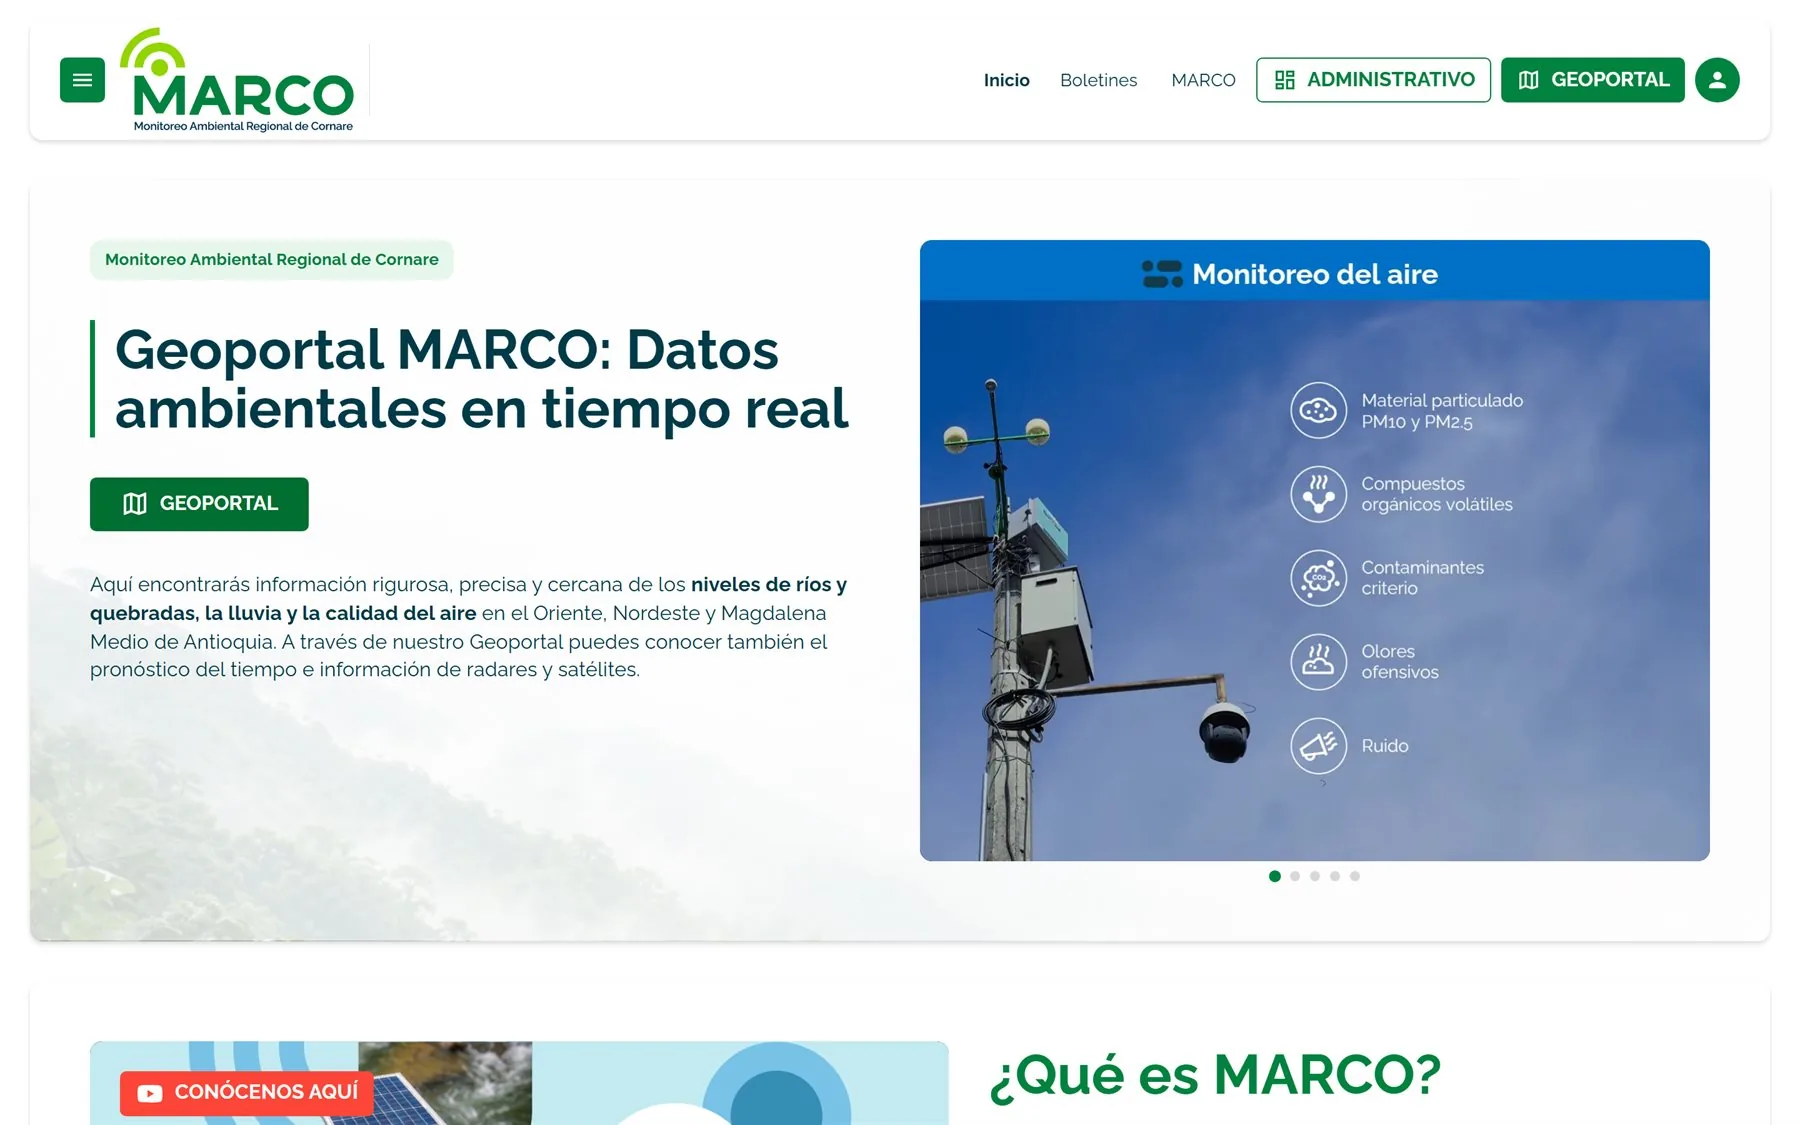
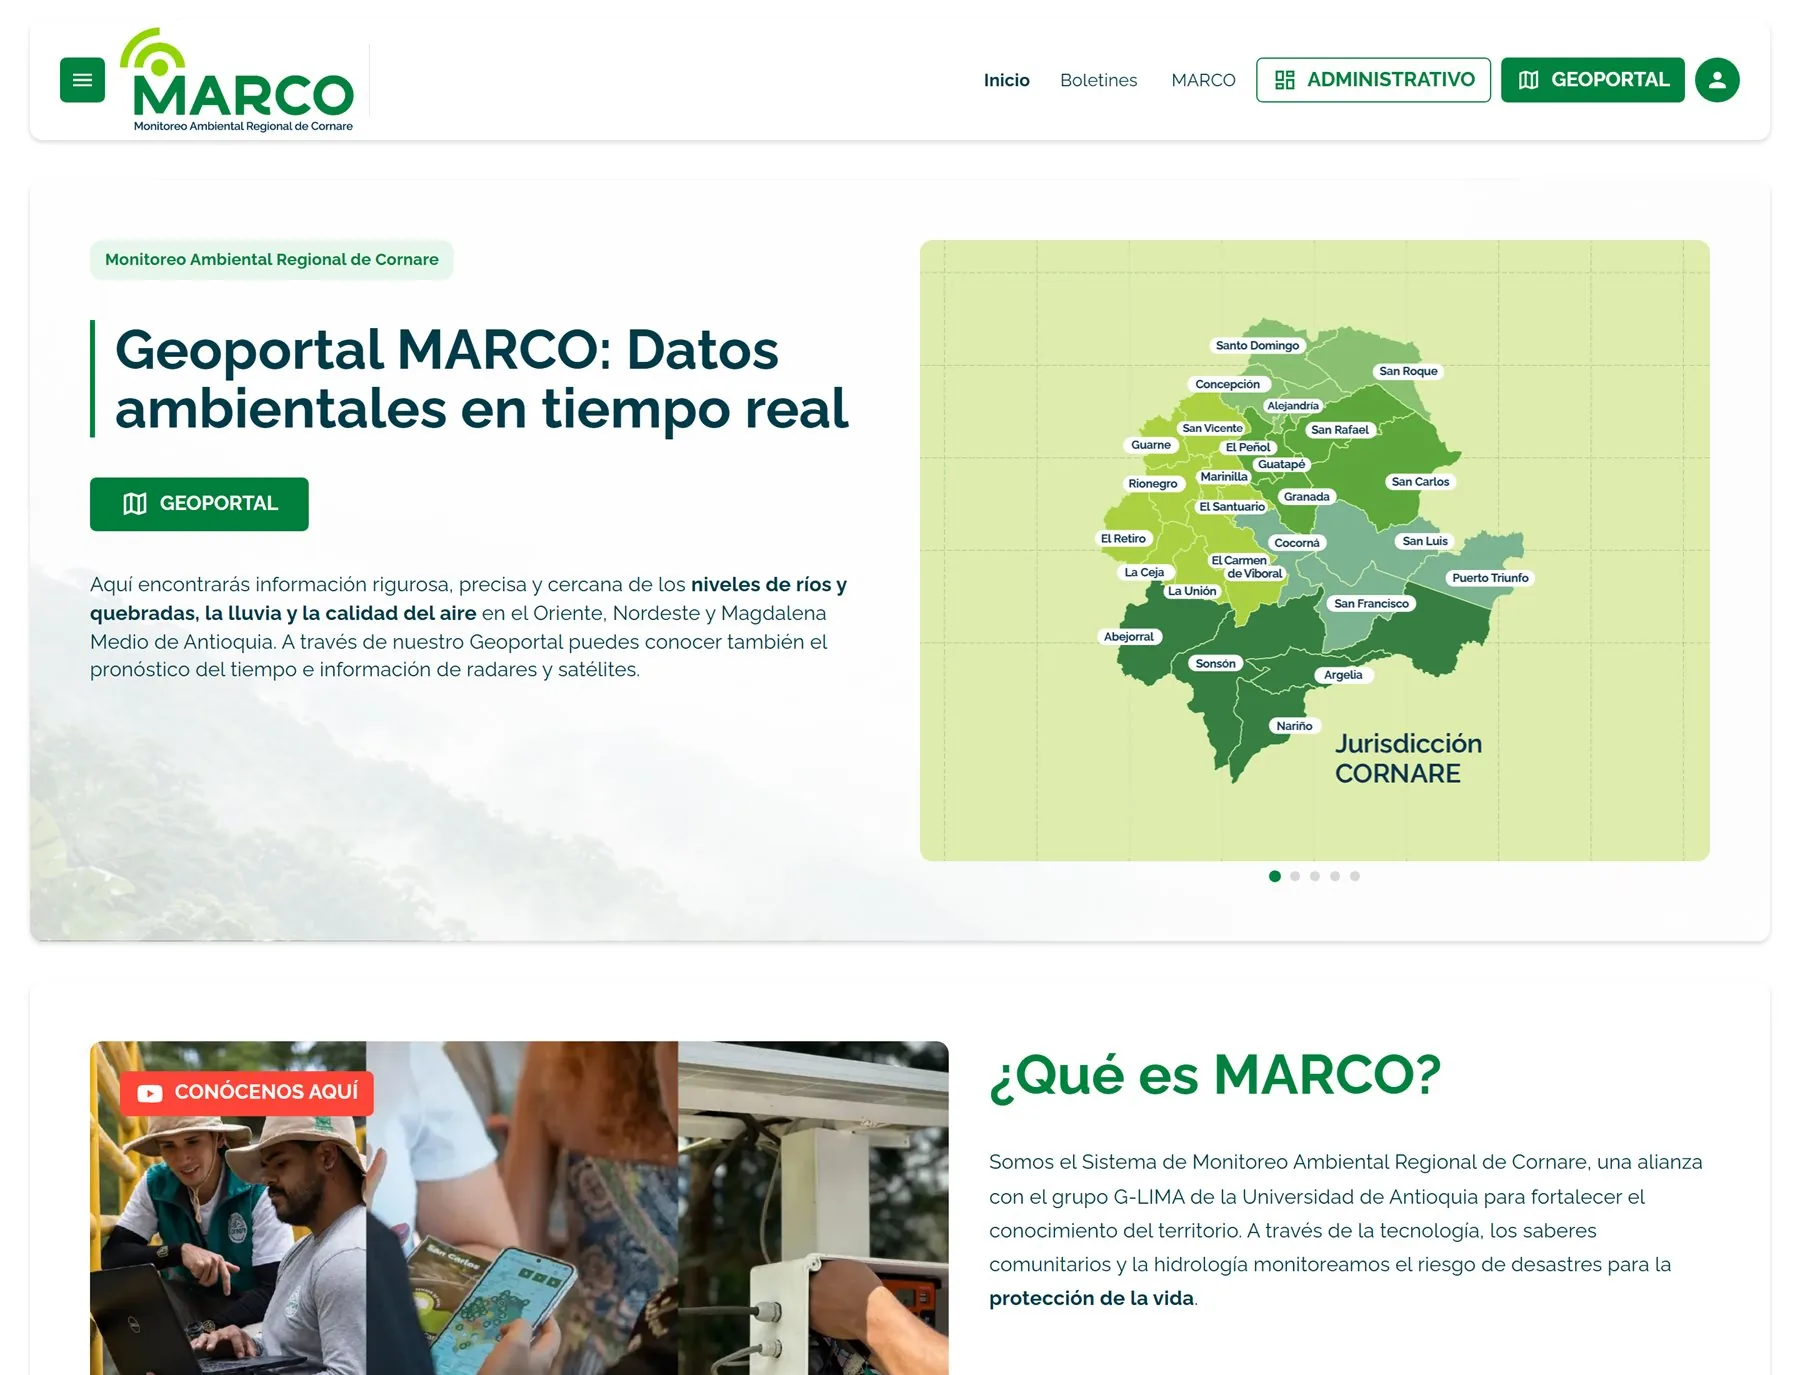
MARCO (Regional Environmental Monitoring of Cornare) is the environmental technology platform developed by Rain Ingeniería for real-time watershed monitoring across 26 municipalities in Eastern Antioquia. The project was already underway with an established technical and visual foundation. Through Rain Ingeniería, my role focused on designing the UX and visual UI for the new homepage, global header and footer, the interactive educational module ('¿Qué es MARCO?'), and the internal data management dashboards. A core requirement was preserving the existing UI and maintaining strict continuity with Cornare's institutional visual identity.
My Role
UI/UX Design for Rain Ingeniería (Homepage, Header, Footer, Educational Module & Internal Dashboards for Cornare)
Challenge
The primary challenge was designing critical new sections — including the header, footer, homepage, educational hub, and internal data dashboards — while rigorously respecting the pre-existing UI and Cornare's visual identity, seamlessly introducing new features without breaking design continuity.
Outcome
A clear and modern interface preserving Cornare's pre-existing visual identity, streamlining public access to the Geoportal and educational materials, while providing technical analysts with robust internal visualization tools for real-time watershed monitoring.
KEY FEATURES
Homepage & Global Navigation
Header, footer, and direct access to Geoportal and watershed maps
Educational Module
¿Qué es MARCO? didactic section for community awareness
Internal Data Dashboards
Technical panels for sensor telemetry and data management
THE CHALLENGE
Preserving the existing UI and integrating new features with total visual coherence.
The primary challenge was designing critical new sections — including the header, footer, homepage, educational hub, and internal data dashboards — while rigorously respecting the pre-existing UI and Cornare's visual identity, seamlessly introducing new features without breaking design continuity.
THE APPROACH
Design system continuity, color-coded hierarchy, and atomic components.
We analyzed the pre-existing visual architecture to design a header and footer unifying platform navigation, a clean homepage with prominent entry points, an illustrated educational module, and internal data management dashboards featuring advanced filters, tables, and interactive time-series telemetry charts.
WEBSITE SHOWCASE
DESIGN SYSTEM
Outfit & Inter
Pairing Outfit for modern dynamic headers with Inter for high precision in numerical charts and cartographic legends.
COLOR PALETTE
UI ELEMENTS
DESIGNED TO CONVERT
UI/UX designed for education and streamlined data management.
From citizen-facing discovery to internal control panels, every interface was crafted for clarity, accessibility, and fast environmental analysis.
FINAL RESULT
Homepage & Global Navigation
Header, footer, and clear navigation for territorial exploration across Cornare watersheds.
Institutional Header & Footer
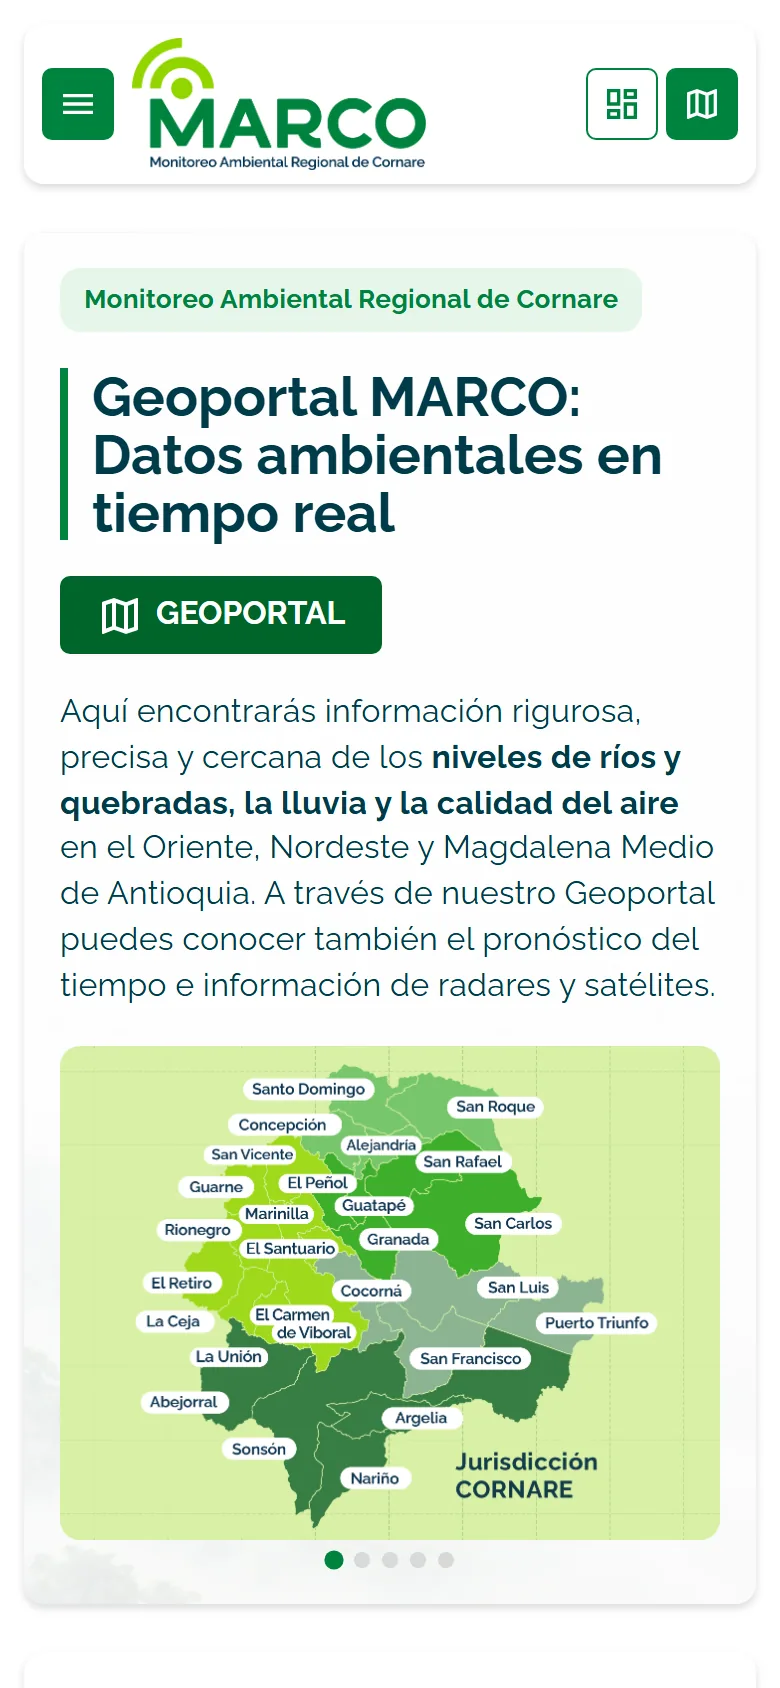
Global navigation bar and footer design, preserving existing UI patterns and providing quick access to the Geoportal and key links.
Homepage UI/UX Design
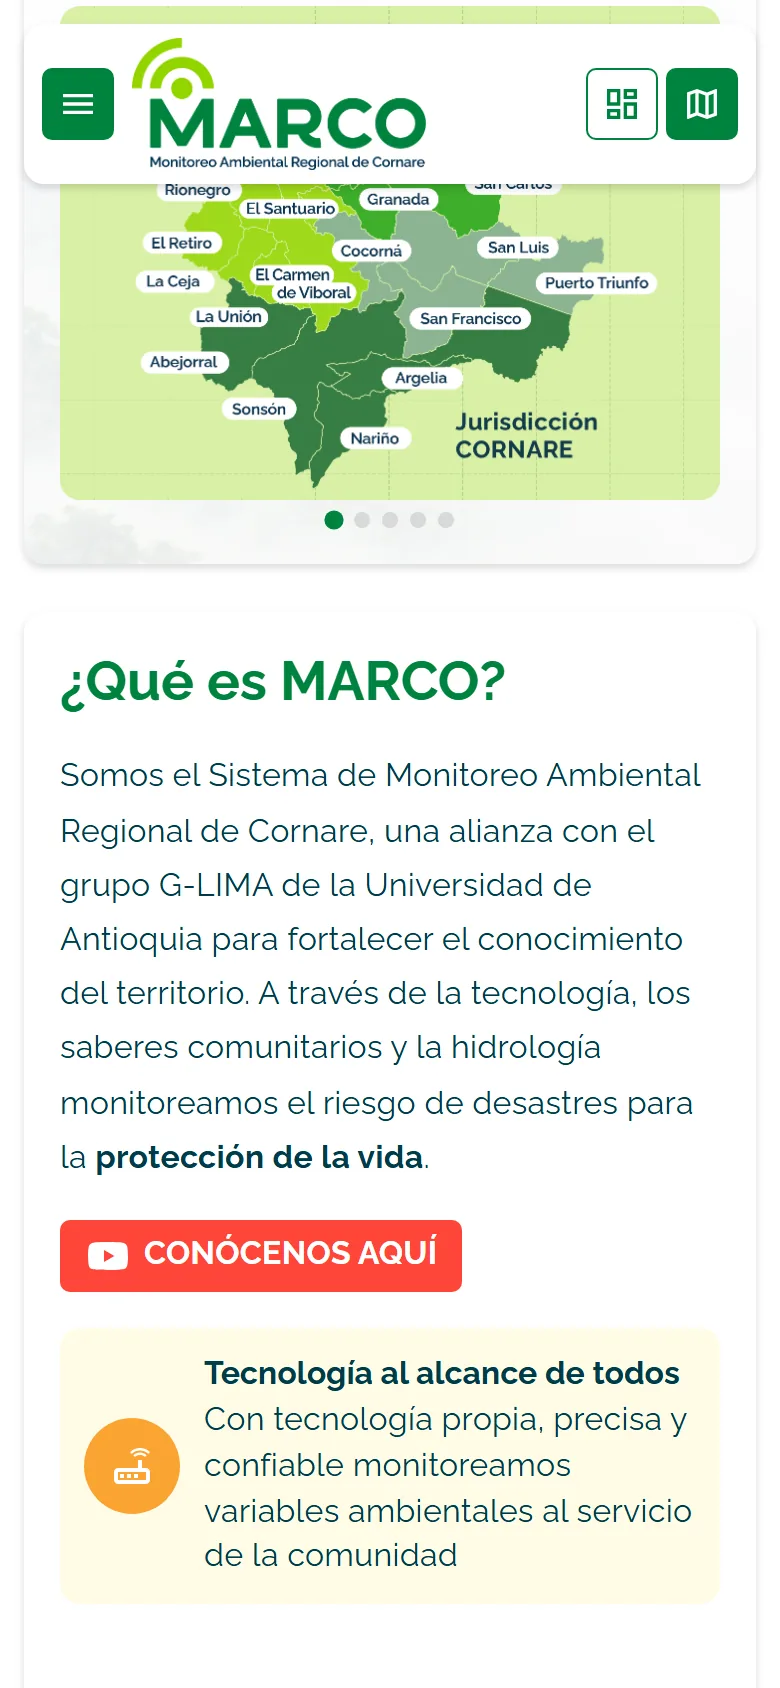
Modern visual hierarchy with quick access to the Geoportal, territorial search, and watershed status.
Interactive Educational Module
Design of the '¿Qué es MARCO?' learning hub with infographics, risk management concepts, and community education.
Internal Data Management Dashboards
Interface design for telemetric sensor monitoring, river level thresholds, and technical alert management.
Figma Design System Continuity
Mapping and extension of components, typographic scales, and color tokens aligned with Cornare's institutional visual identity.
Educational & Learning Hub
Structured content and visual assets bringing environmental risk awareness to the public.
Internal Data Dashboards
Internal analyst tools for hydrometeorological sensor visualization and data management.